Polychrome Developer Tools Index: Net Revenue Retention Rate
“It means that over half of the variance in YoY Revenue Growth is explained by Net Revenue Retention.”
The quarter has closed and it’s time to review our developer tools indices. Following the indices is fun, but diving into the details of these companies is how we will really learn from the exercise. This quarter, we are going to dig into Net Revenue Retention Rate. We will start by defining the metric, and then take a look at how the companies in our index fare with the metric and what impact that appears to have on their success.
Definition of Net Revenue Retention Rate
Call Net Revenue Retention Rate what you want; I call it the key to economic success for a SaaS business. So let’s dig into the metric.
Net Revenue Retention Rate is the amount of money that the customers you had in a previous period are paying you in the current period, divided by what they were paying you in that earlier period. Let’s draw that formula out for clarity:
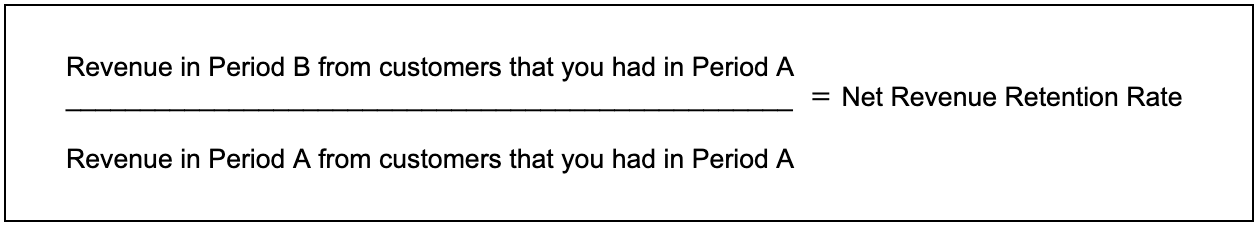
A few notes that may or may not be clear from the formula:
- Most of the time this is compared year-over-year. For example Period A is 2019, and Period B is 2020. Or Period A is Q4-2019, and Period B is Q4-2020.
- The number in the denominator includes revenue from all the customers that you had in period A, even if those customers are no longer contributing to the numerator.
- The number in the numerator does not include any new customers. It can only be increased from the number in the denominator by expansion.
- The number in the numerator can be decreased from the number in the denominator by churn and contraction.
This metric goes by a lot of names, but they are all calculating the same thing. You might come across: Dollar-Based Net Retention, Dollar-Based Net Expansion, Net Dollar Retention, Net Expansion, MRR Retention, or similar variations.
Public companies even tweak the formula slightly based on their business. Particularly some businesses will split out divisions that are included or not included. A common one is for businesses to publicly report the Net Revenue Retention Rate of just their cloud business. For a new SaaS business it’s probably best to track this as an overall metric, and a metric for sub groups of your business (divisions, customer sizes, or cohorts). Play around with the sub groups and find what is meaningful. This will help you understand the business as a whole, and which parts of the business are shining or need some attention.
Why Net Revenue Retention Rate is Important
There’s lot of SaaS metrics that people like. Why is this one so important? I like this metric because it is the all encompassing measure that shows if you have a handle on churn, expansion, and contraction. That really helps you understand how your SaaS business is doing; it’s an indicator for customer satisfaction, product-market-fit, pricing effectiveness, competition, and more.
It is also extremely powerful! If your Net Revenue Retention Rate is greater than 100%, that means that your business is growing even without adding new customers. And that growth compounds! Less than 100% means that your business is default shrinking, it’s a leaky bucket you have to keep filling. Filling that bucket costs a lot in sales and marketing.
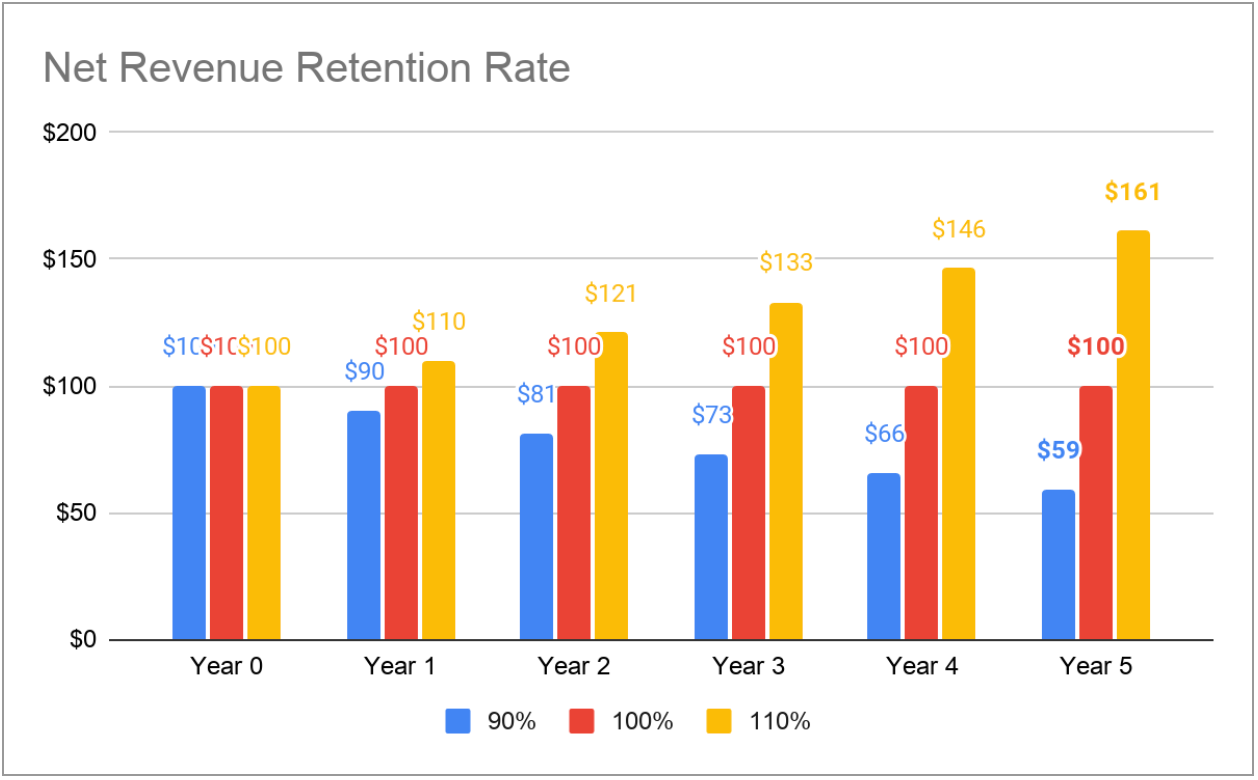
Tomasz Tunguz wrote an analysis that illustrated how each additional 20% increase equates to a doubling of revenue in 5 years. Below I have modeled out the difference for a company’s revenue, all else equal, with 90%, 100%, and 110% Net Revenue Retention Rates over 5 years. These sound like small changes, but the impact is big!
Comparing Net Revenue Retention Rate
Since public companies share their financials and select metrics, we can use the Polychrome Developer Tools Public 20 as a sample set to learn more about the importance of this metric. Luckily almost all of them also share their Net Revenue Retention Rate. First, let’s look at the data. Here is the Public 20 chart with Net Revenue Retention Rate for each company.
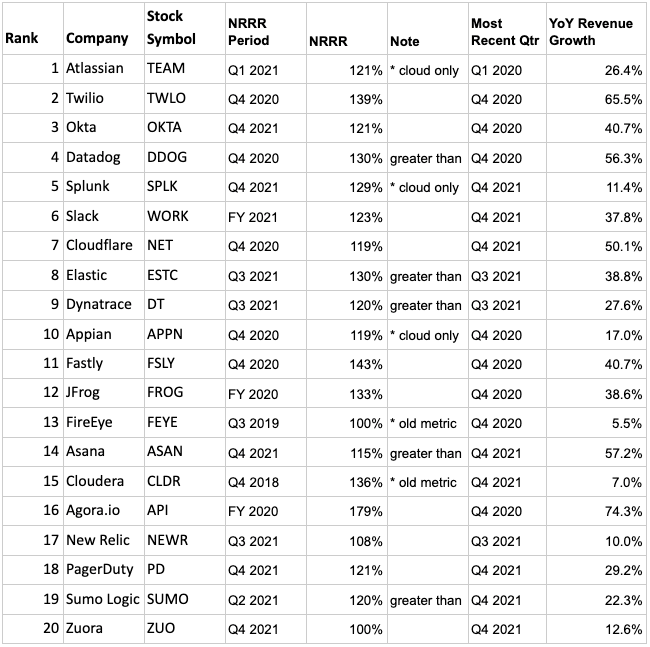
* Companies who report their Net Revenue Retention Rate on only a portion of their business, or the data available is out of date.
The first thing to note is that all of these companies have impressive Net Revenue Retention Rates. It shows the power of both SaaS and Developer Tools. But there are still differences, and as explained above, a small difference in Revenue Retention can have a big impact. So let’s plot these against revenue growth rates and see if there is a correlation. For this, we have to exclude the asterisks.
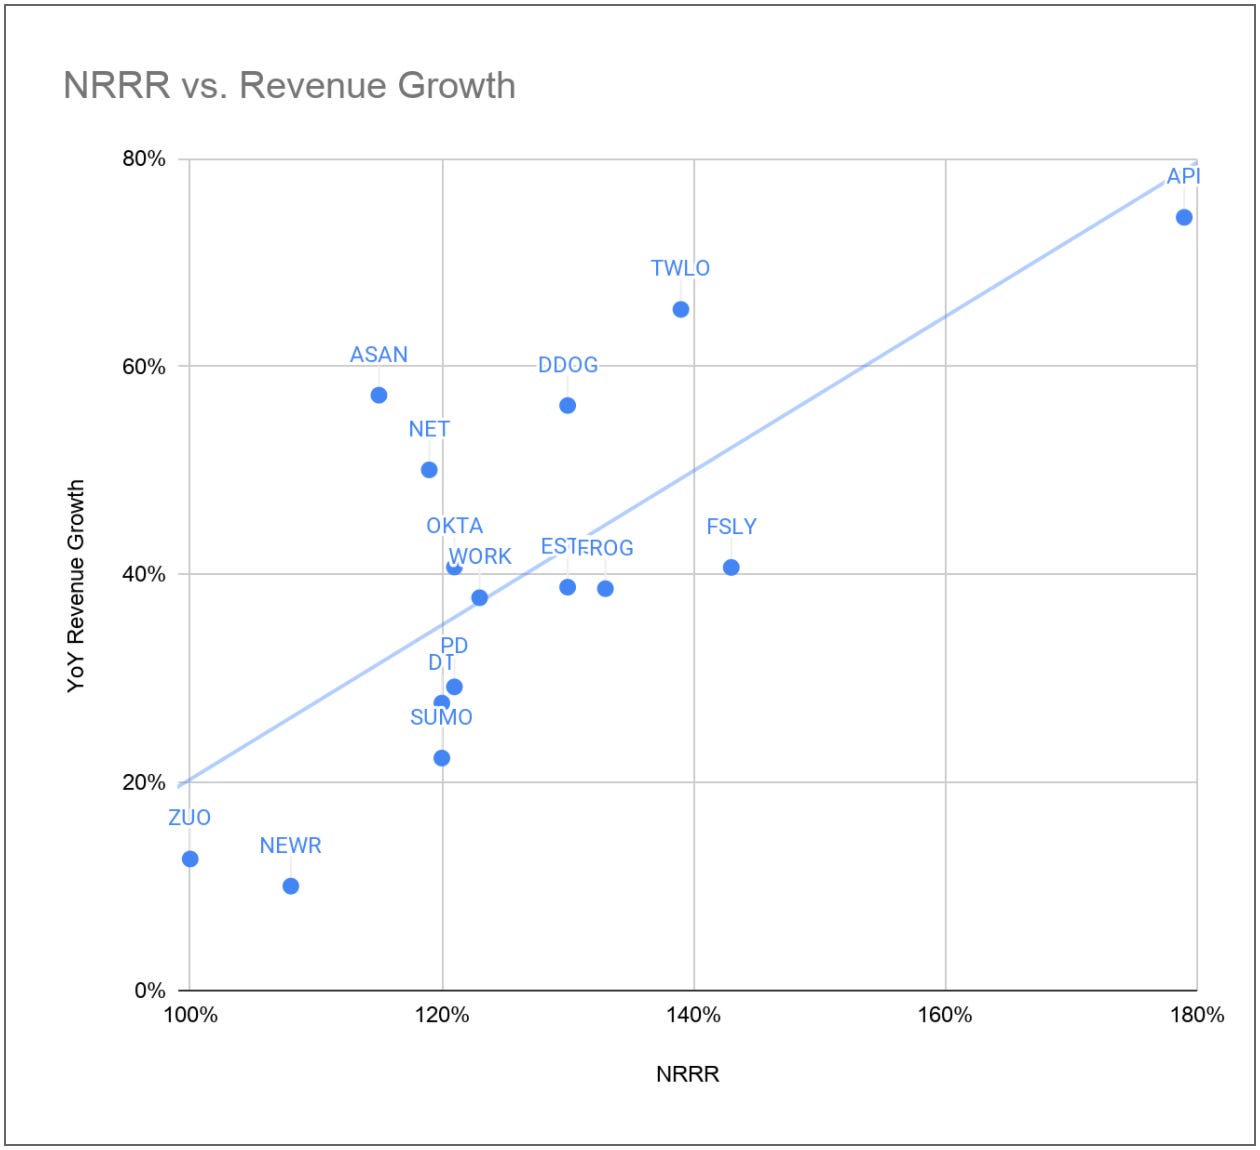
The correlation, or R, of 0.734 shows how directly related the two are, something we probably naturally understood. However interpreting the R² of 0.539 is the more interesting point. It means that over half of the variance in YoY Revenue Growth is explained by Net Revenue Retention. This is amazing, over half!
That should make any founder step back and think if they are proportionately investing in retaining and growing their customers vs. getting new ones. The R² gives you a simple guide - it should be about half of your efforts!
Polychrome Developer Tools Indices Q1 Performance
The impressive Net Revenue Retention Rates of these companies has been a key factor to their success; and it’s a big reason we love the space. With Q1 closed, let's continue our journey following these companies through the lens of our two indices.
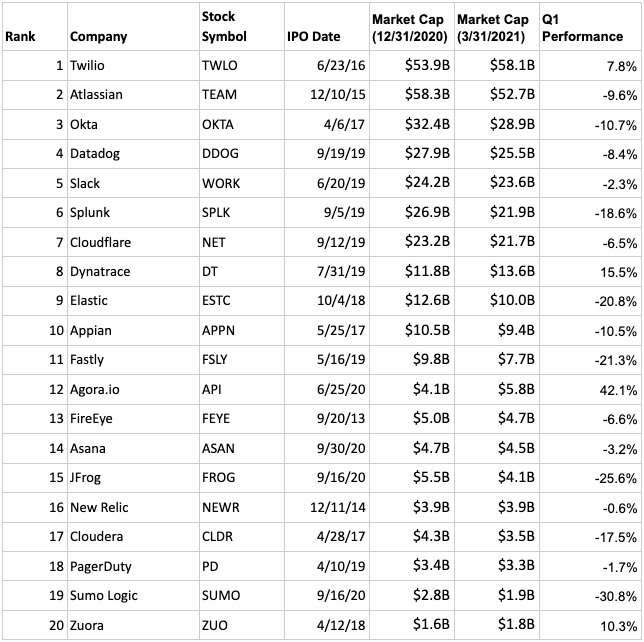
Polychrome Developer Tools Public 20
This list is the most valuable 20 developer tools companies, by market cap, which initially listed their stock publicly within the last 10 years - (as of Jan 1, 2021). The update we will track here is market cap, and compare the performance vs. other indices over the quarter.
It was a tough quarter for technology, and the Polychrome Developer Tools Public 20 is down for the quarter. Take a look as compared to other indices.
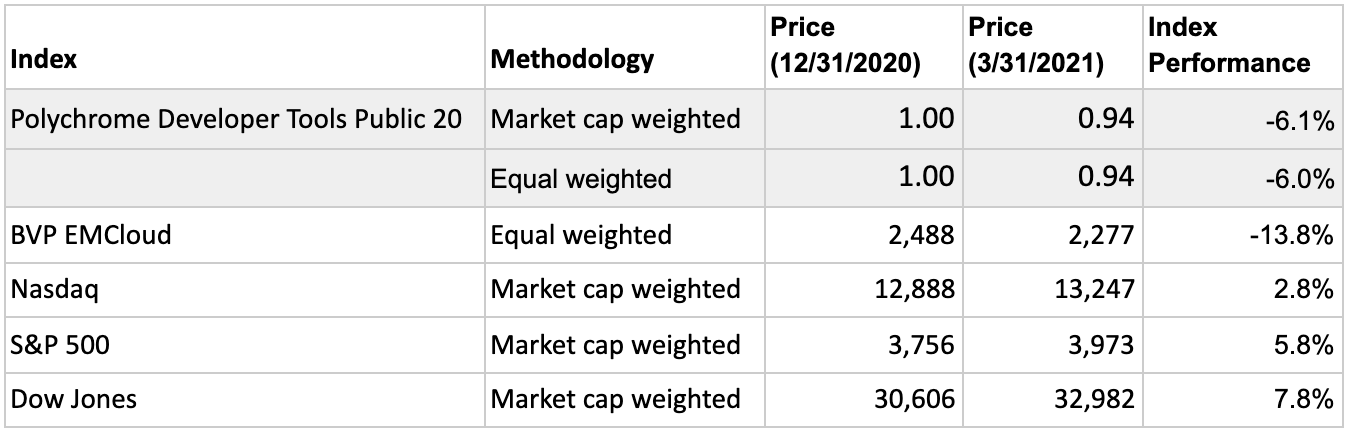
The story varies a little bit when you look at the individual companies, but overall the public markets were harsh on tech in Q1.
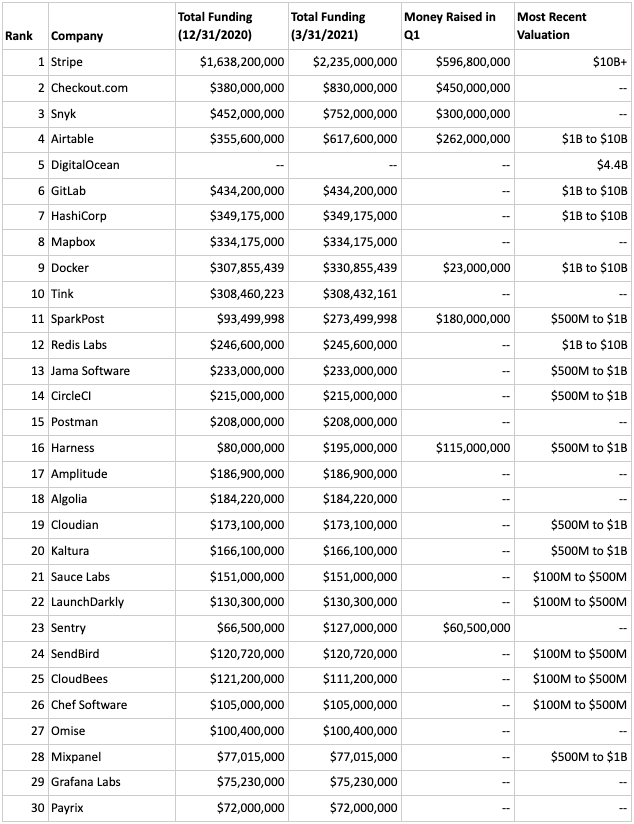
Polychrome Developer Tools Private 30
This list is the 30 most funded developer tools companies, by dollars raised, which remain private - (as of Jan 1, 2021). This updates total funding, valuation range, and shares a few items to note.
Private companies valuations are less volatile as compared to public stocks. From the look of these companies, the quarter was pretty positive.
- One of the companies went public! DigitalOcean had its IPO on March 24th at $47.00 per share, raising $900M, and giving it a market cap of $5B. Their 2020 Net Revenue Retention Rate was 103%, and their Q4 2020 YoY Revenue Growth rate was 23%.
- Eight companies raised almost $2B in capital in Q1 2021, taking the total funding of the index from $7.4B to $9.3B (excluding DOCN).
I hope you enjoyed the read and have a better understanding of Net Revenue Retention Rate! Please comment on the next topic you would like to dive into.
Thanks,
Alex

© 2023 Polychrome Holding Company