Polychrome Developer Tools Index: Valuation Ratios
The quarter has closed and it’s time to review our developer tools indices. Along with a check in, we’re using our indices to look at the overall movement in the market. What has happened to tech stocks in the last quarter and is it rational? That’s what we will dive into in this post.
A Market Correction
When the market goes down by 10% or more, that’s technically called a “correction”. I usually laugh because it’s a sugar coated way to say “10% decline”, and it implies that the previous prices were wrong and the new ones are right, which of course no one knows for sure. Let’s spend a little more time and see if we think this decline in Q1 is a correction or something else. To do that, we will take a look at financial ratios used to value companies and see how they compare over time. We will use the companies in our Polychrome Developer Tools Public 25 index to illustrate.
External Financial Metrics
Definitions
In a previous post, I reviewed some internal financial metrics that help SaaS companies manage their operations. These valuation ratios are a bit different. These are external metrics that investors use to value software companies.
Today we will have some fun and try to decipher the market a bit, but it’s important to keep in mind that while valuations and stock prices move quickly with market trends, in general the underlying businesses continue to operate the same. Same people, same product, same customers - as operators we know the best thing to do is keep our head down and focus on the things we can control within our business. If that gets you excited you can stop reading now and get back to work, no hard feelings.
But let’s have our fun. I’ll take a look at a traditional financial metric, and one that has been used as a valuation rule for software over the last few years.
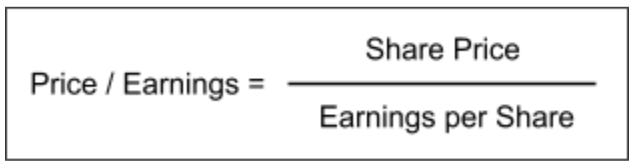
- Price / Earnings Ratio: If you invest based on the present value of all future cash flows, you probably pay a lot of attention to P/E ratios. A higher P/E ratio means the market is putting a higher relative price on that company.
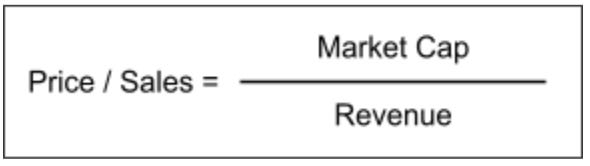
- Price / Sales Ratio (aka Revenue Multiple): Want to see how a high growth software company is valued as compared to others? A common metric used is the revenue multiple: Price / Sales. This is more common because the value in high growth businesses isn’t knowable from the earnings today, it’s based on future expectations.
History
To set some context, let’s look at the most broad view of each ratio available. For this I will use the S&P 500, which is a good indicator of the general market.
S&P 500 P/E Ratio - All Time
This one dates all the way back to the 1800’s. Probably better to focus on the last 20 years or so.

Source: https://data.nasdaq.com/data/MULTPL/SP500_PE_RATIO_YEAR
S&P 500 P/S Ratio - 20yrs
This graph only shows the last 20 years, that’s all that was publicly available.
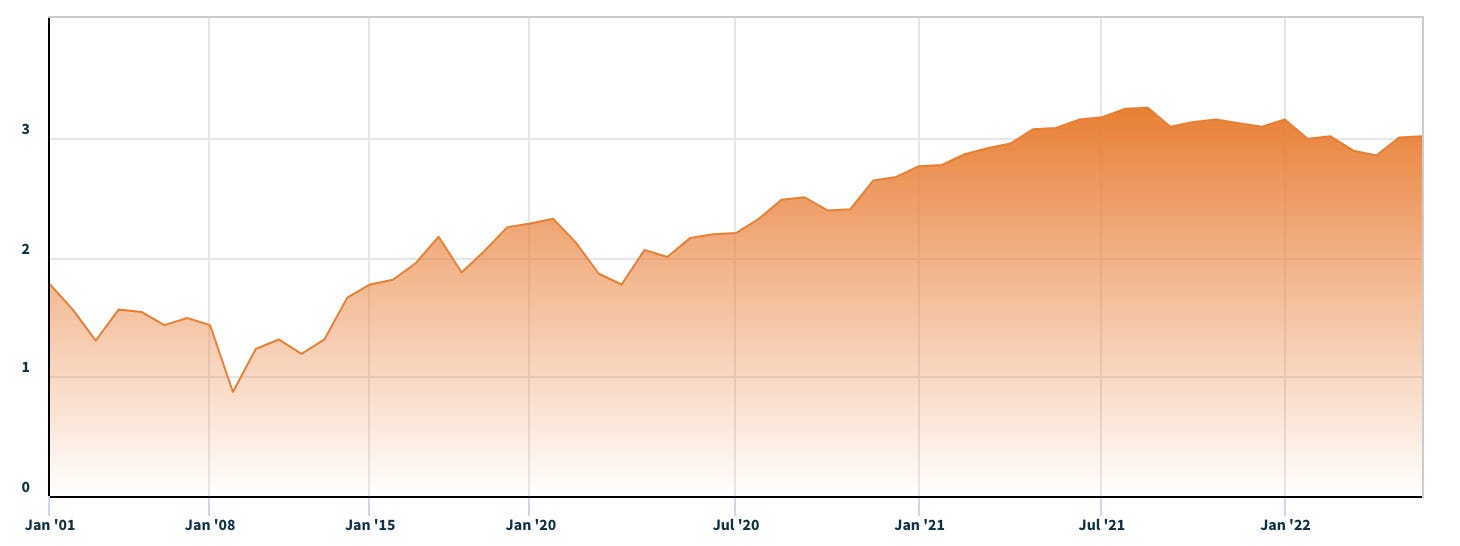
Source: https://data.nasdaq.com/data/MULTPL/SP500_PSR_YEAR
These charts show that both ratios have increased over time, and that they were at or near all time highs in 2021. Even after this decline they are on the high end relative to historical trends.
Comparisons
Now let’s check out how the specific companies in our index measure up. Our index is pretty young, so I chose to go back just 5 years1.
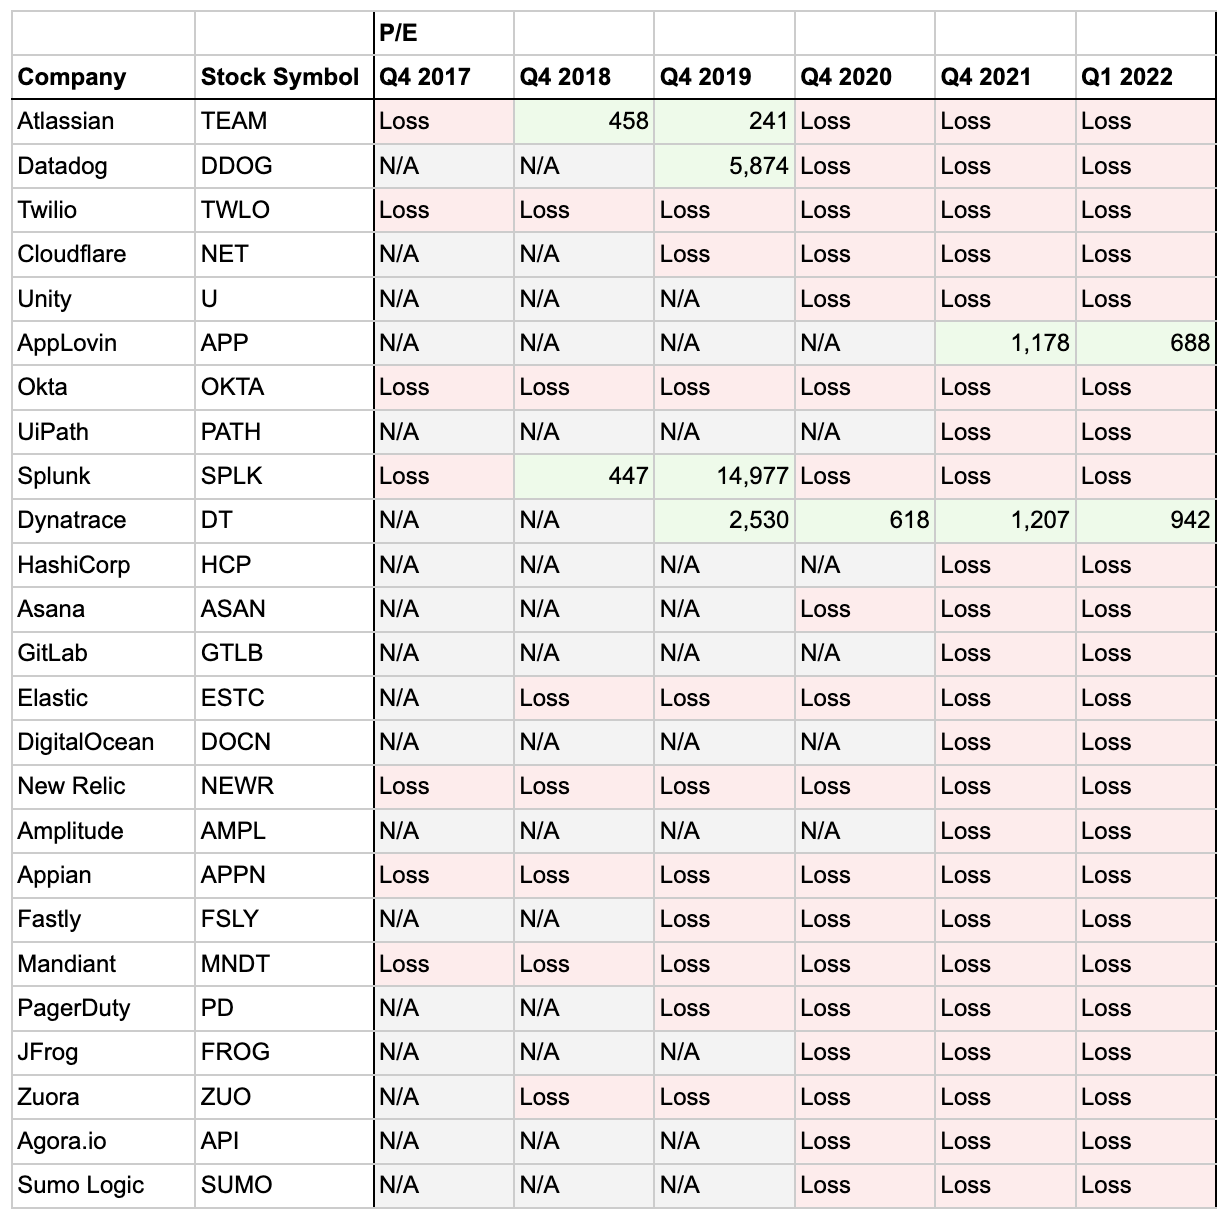
P/E Ratio
With that out of the way, here is the historical P/E Ratio for each of the companies in our index. The first thing you notice is that any of these companies delivering a profit is rare. And when they do, the P/E Ratio is wildly high compared to the broader market, which ended the year around 30 (see above). It’s clear that these stocks are not being valued on a simple P/E Ratio.
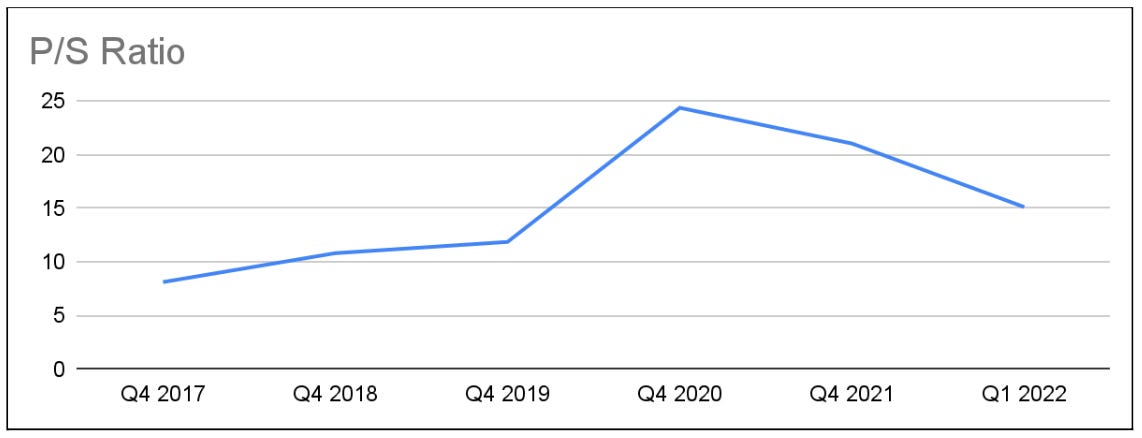
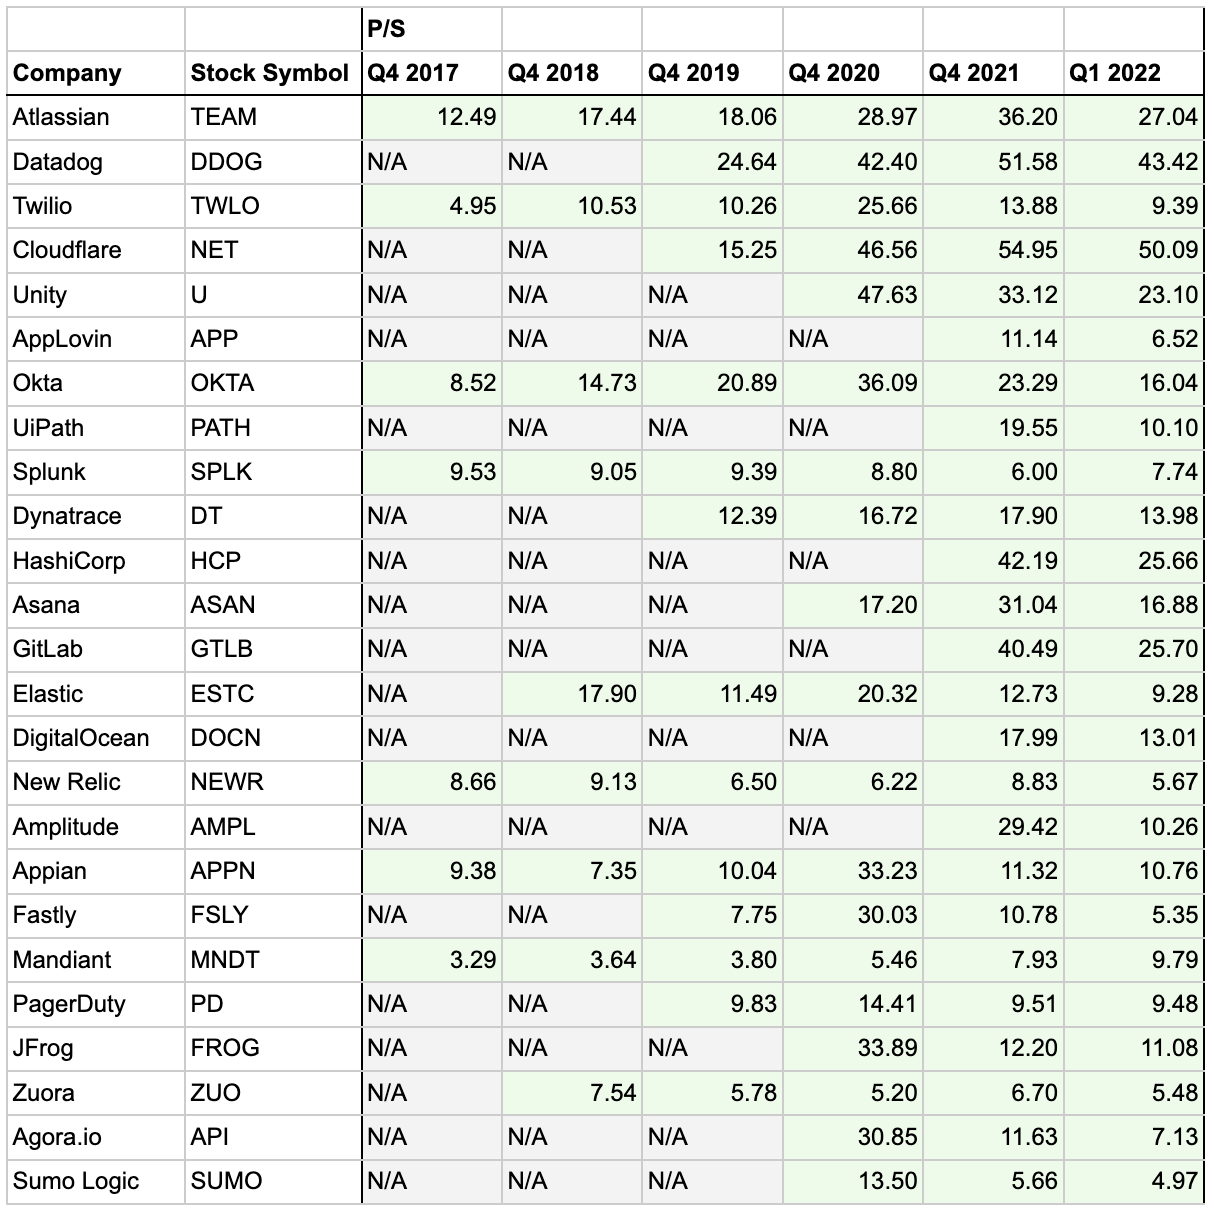
P/S Ratio
Let’s take a look at the Price / Sales Ratio for each of the companies in our index. This starts to show some trends, so I also included a chart that is a simple average of our index companies. You can see the ratio rose from about 8 back in 2017 to almost 25 in 2020, and back down to 15 as of Q1 2022. On the individual level, almost every single company followed this general trend. It’s also interesting to note that these are significantly higher than the general market, which ended the year around 3. Clearly the market is valuing the companies in this index higher than most public companies. This is based on future growth and profitability expectations, neither of which are easily captured or explained in ratios like these.
What Is Correct?
Now we have seen the ratios over time for the broader market, and for our index. So has this decline been a “correction”? Has it over or under corrected? I can’t answer that question for sure, but looking at the trends it gives me the feeling that in large the spike we saw in 2020 and 2021 were above normal prices and we are back into a more “normal” range. Time will tell, there are many factors, and some individual companies will live up to much greater valuations, while others fall far short.
Polychrome Developer Tools Indices Q1 Performance
Polychrome Developer Tools Public 25
We recently shared the details of the companies in the Polychrome Developer Tools Public 25 for 2022. With a quarter down, let’s check in on them.
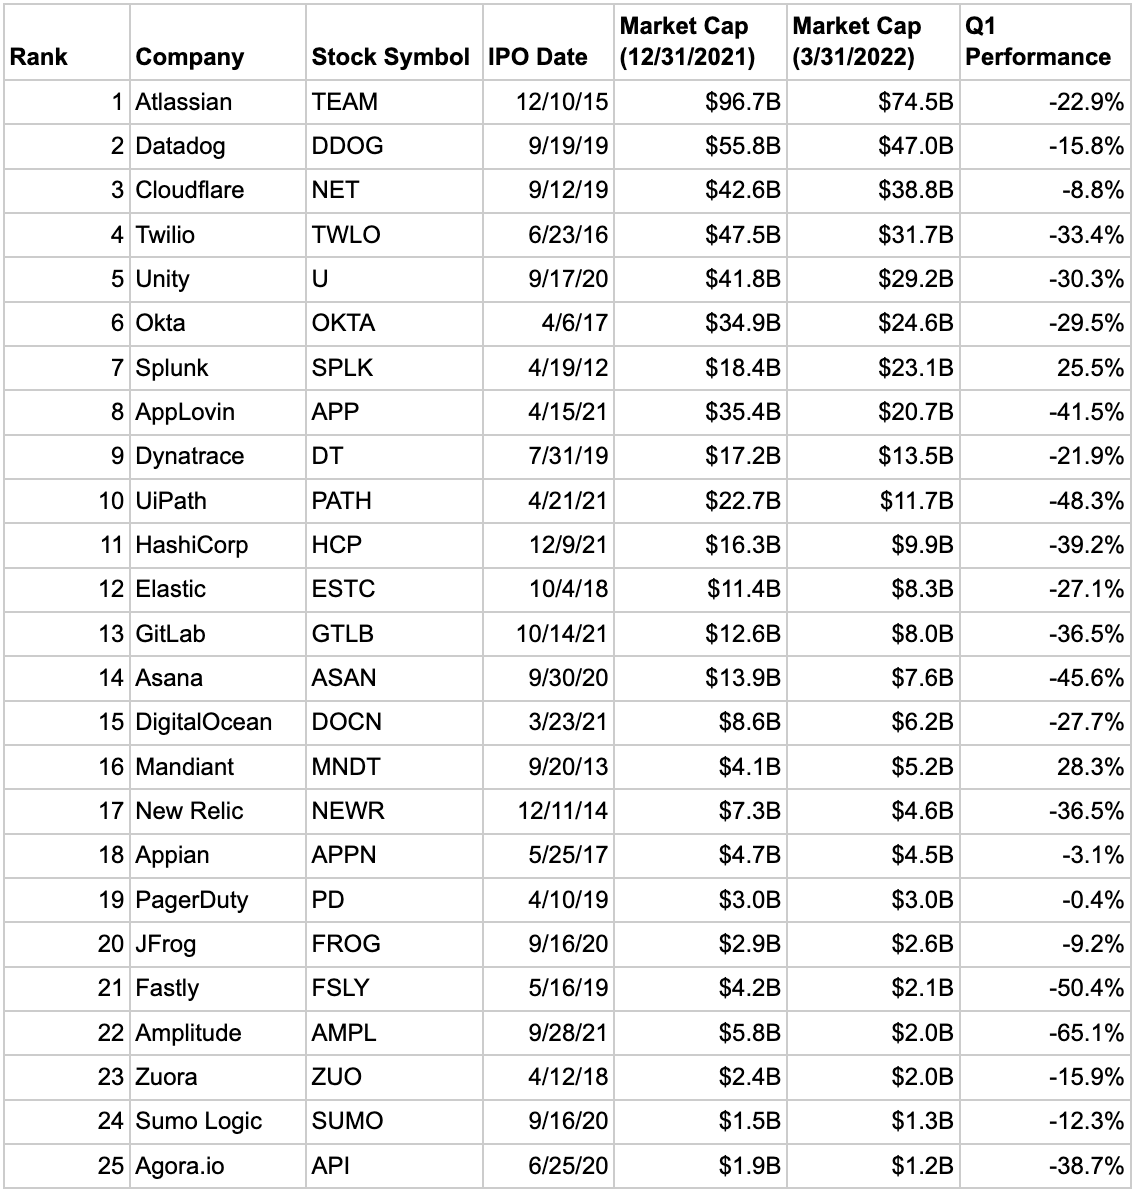
As we saw in the ratios above, Q1 was tough on the market, and even more so on the companies in this index. In fact, down 25.4% on the quarter, the performance was so poor that the index gave up all the gains from 2021 and then some. Here’s how the quarter ended and how that compares to other indices.
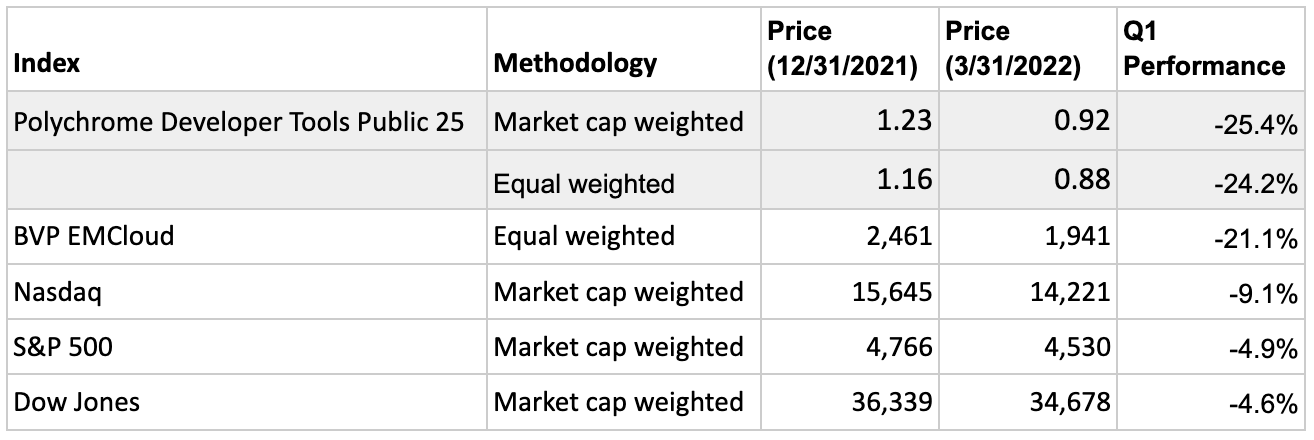
On an individual basis, the results were surprisingly uniform. Every single company was down in the quarter, except two, both of which are being acquired (Mandiant by Google, and Splunk by Cisco).
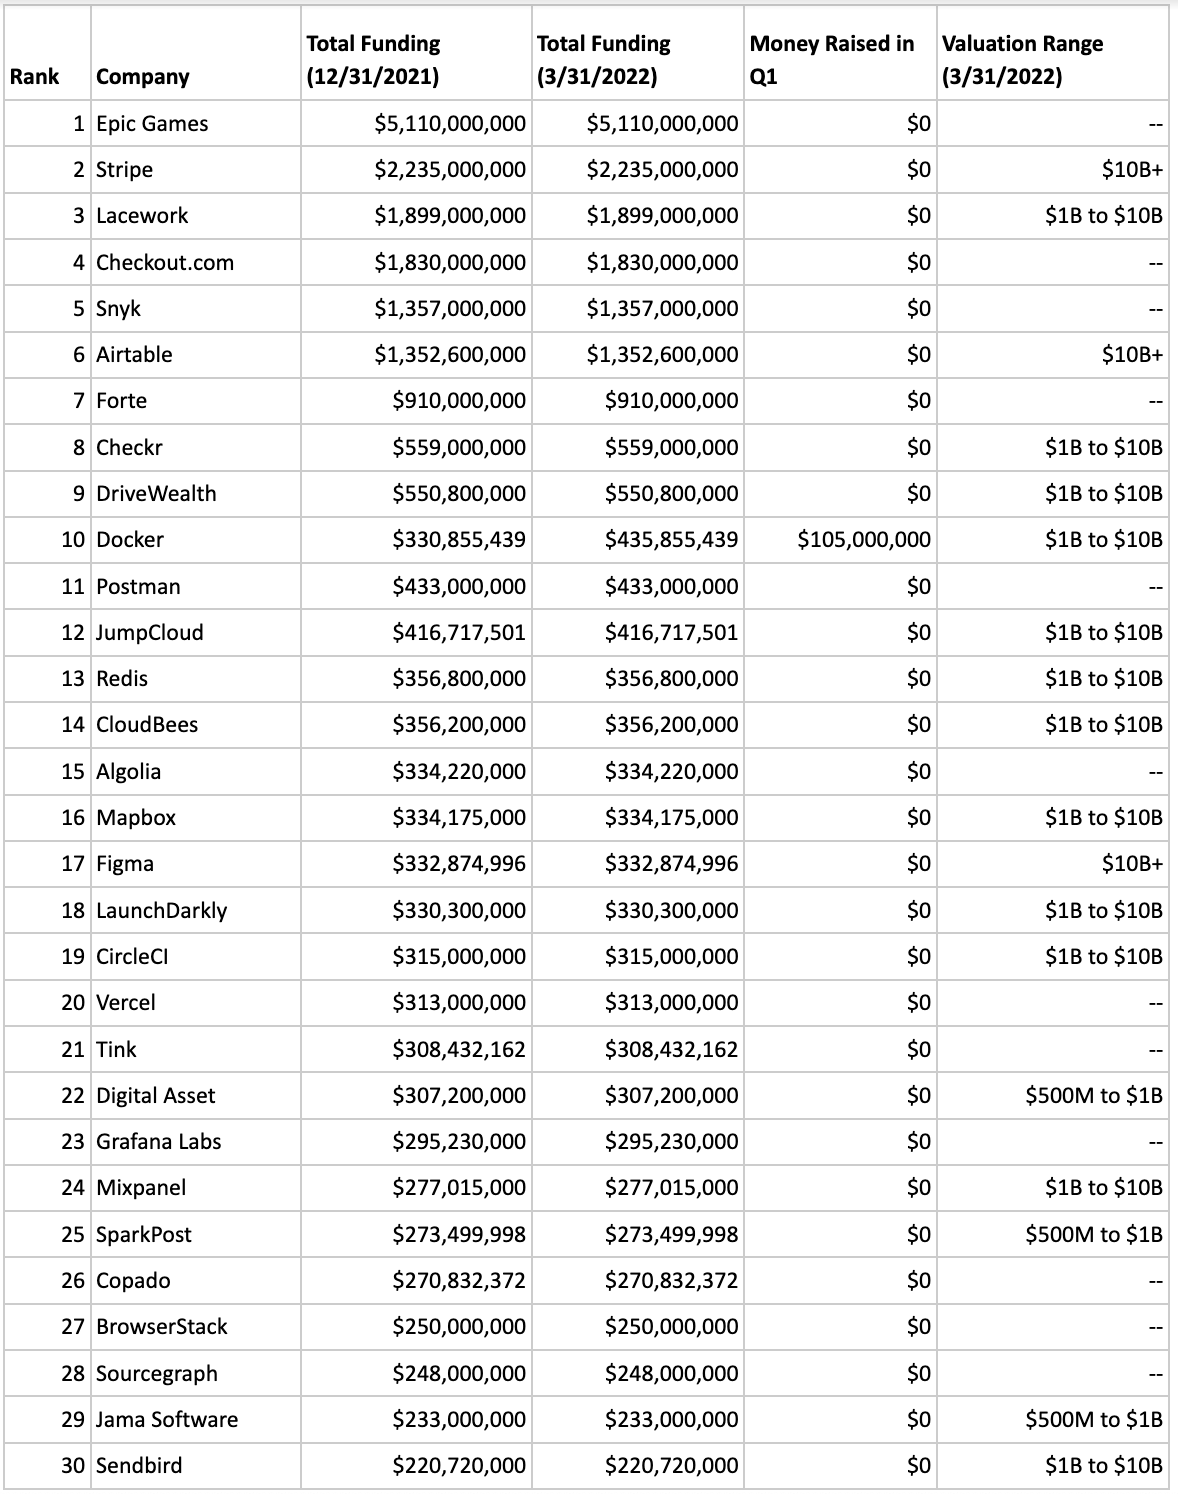
Polychrome Developer Tools Private 30
One big question that has been on my mind is how the changes in the public markets are impacting the private market. Are companies still raising rounds? Are there IPOs? Are valuations down? Let’s check out our Polychrome Developer Tools Private 30 index to see.
- Are companies still raising rounds? One company raised $105M in Q1 2022, taking the total funding of the index from $22.3B to $22.7B. This is no question lower than our average quarter for 2021, which was around 5 raises and $1.5B. It’s fair to say that the pace of fundraising slowed in Q1.
- Are there IPOs? There were no IPOs in Q1. Last year there were 5 IPOs in the year, so this is showing some weakness.
- Are valuations down? Unfortunately due to the nature of private transactions I couldn’t obtain that information for certain. However, the size of the one round, raised by Docker, feels small. They had previously raised $330M, adding $105M is not an aggressive investment it feels more like a bridge round.
Overall the story is pretty consistent; private markets are less volatile, but they were weaker in Q1 along with the public market.
I hope this was interesting. Now let’s get back to focusing on the things we can control within our businesses!
Thanks,
Alex
---
A few notes on methodology: a) I am using GAAP/IFRS definitions for EPS. b) I am calculating Revenue based on Q4 * 4 instead of trailing twelve months, to easier align across calendar years. c) Since we do not yet have Q1 2022 Revenue, I am assuming Q4 2021 * 4. d) Some companies do not have 5 years of public financials, in that case I wrote “N/A”. Some companies had an earnings loss in some or all periods, in that case I wrote “Loss” for the P/E Ratio. e) Some companies end their fiscal quarter on Dec 31, others on Jan 31. I used the fiscal year end for Revenue and EPS. I used the calendar year end for Market Cap and Price. f) Mandiant (MNDT) sold its FireEye division in Q4 2021, I used EPS from continuing operations only.

© 2023 Polychrome Holding Company